Introduction
Over the past few weeks we’ve been using our geographic skills to
aid in a land navigation course at the UW-Eau Claire priory (see Study Area
section for more info). Each week we had a different toolset to use in the
completion of our navigation task.
Week 1 we used a student created map with two and five foot
contours, and a traditional compass.
Week 2 we used ONLY a GPS with UTM coordinates.
Week 3 we used a GPS with UTM coordinates, and our original
created map.
This report should outline each week and hopefully help us to
understand our efficiency with the different tools.
Week 1
As mentioned earlier, The tools we were expected to use in Week 1 were
as follows: 5foot contour map (Figure 1), 2foot contour map (Figure 2), compass
(Figure 3), our pace count, and the UTM points given to us by our professor
(Figure 4). This was done in a traditional orienteering fashion.
Orienteering is, for some a hobby, and others a necessary tool in
the work place. For instance, there are many clubs and groups you can join who
have the common hobby of orienteering (see www.us.orienteering.org). In other
cases though, orienteering/land navigation can be used as a training exercise
for military or based organizations. I’ve had discussions with former military
personnel who tell stories of doing the exact same thing we’re doing, but on a
much larger scale. What is important to realize from the obvious popularity and
wide array of uses for such a tool, is that land navigation is a vital tool to
many people, and many professions. Land navigation is not simply the product of
a geographer’s nerd session, but a valuable and widely used geospatial tool.
For this exercise we were tasked with using only a few tools to
complete the land navigation course the two most important being our compass
and our topographic map we created last week. (See methods section for complete
walkthrough). It was interesting because with a compass alone we can’t navigate
to and from our points. Nor with a topographic map alone could we navigate to
the points. We needed a frame of reference as well as points themselves, and an
origin point (luckily we were provided these points, the origin, and a physical
compass by our professor). By combining these UTM points, our compass and our
topographic map (in UTM coordinate reference) we are able to navigate to the
given points. One tool is good, two tools is better, but having all three leads
to successful completion of the task.
What makes this exercise so valuable is that it is a culmination
of a few of our previously learned/developed skills. A few weeks ago we
perfected our compass skills and learned how to plot and map points based on
azimuth and distance, last week we learned how to create topographic maps with
a UTM reference, and this week we got to combine them.
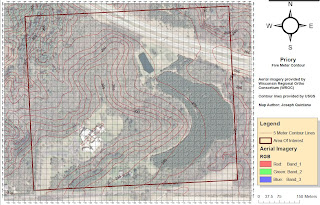 |
| Figure 1: 5Foot Contour Map created by myself. Notice the UTM grid that will aid in navigating when in the field next week. It will also help in aligning our compases with north in the pre field work. |
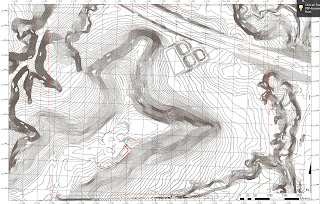 |
| Figure 2: 2Foot Contour map created by my groupmate Brandon. This should help us to get a forecast of our terrain before we have to traverse over to it. Also well help us to know what the terrain should be like near points we have to navigate to. |
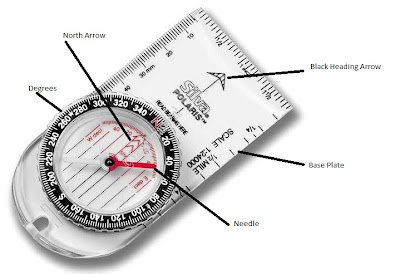 |
| Figure 3: Actual Compass used in field with the parts of the compas labeled as well. use for reference when going throug the later parts of this lab writeup. Photo Credit: Hannah Bristol |
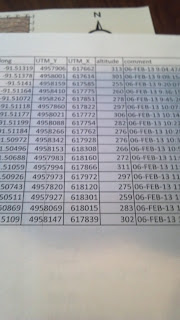 |
| Figure 4: UTM coordinates provided by Joe Hupy. Noted on the provided document is the UTM grid coordinates ona cartesian plane system, elevation of each point, Date the point was plotted, and the latitude and longitude. |
Week 2
In week 2 we completed the course using only our GPS units and a
list of UTM coordinates. This brought a new challenge to the task because we
could no longer use our topographical maps. The main purpose of our activity
was to determine how efficient we could be using GPS as our sole navigation,
that is, how does having only one tool change the landscape of the event. (one
tool is good, two tools is better, three tools is great….) It was time to see
how we fared with only one of our tools.
For this exercise we worked in the same groups as the compass
navigation, but this time we worked on a new orienteering course (last week we
worked on course 3, and course 1 this week).
We each had our own eTrex GPS unit, with a list of UTM coordinates
for each point we had to get to. We were then able to navigate to the list of
points based on matching our UTM coordinate readings to the ones provided to
us.
For this portion of the exercise it was important to understand
exactly what UTM coordinates means. Universal Transverse Mercator, or UTM,
refers to the series of map projections used to determine exact geographical
locations. It is similar to the latitude and longitude but is split into zones
across the hemispheres to make it far more localized and useful than
traditional latitude and longitudinal navigation methods. Earth is split into
60 zones and here in western Wisconsin we fit into the zone 15 North. UTM lays
out a Cartesian coordinate based on meters within each zone. This allows us to
follow as out X and Y coordinates go up or down, we can travel north/south,
east/west.
What makes this exercise valuable is the fact that we are going to
experiment a similar process but with different tools. Part of the scientific
method is retrying your project, to get similar results. Here we are re-doing
our original Land Nav, but with a different tool. Then we can compare the efficiently
and overall navigation skills to see which tool worked better or worse.
Week 3
Week three was one where we could combine different sets of
tools to give us the best three we could ask for. This week we combined our
GPS, UTM coordinates, and our topographic maps in order to complete the entire 15-point
course. We also added full paintball gear to mix to add an extra level of difficulty.
This week was also important because it was somewhat of an all-encompassing
culmination of our skill sets we’ve been working on. We had to create new maps
with the points, and paintball course information, we had to use GPS
navigation, and had to use our map reading skills in order to complete the
entire course.
Study Area
Before we get into the methodology of each week, it is important
to understand the area in which we are doing our exercises.
The University of
Wisconsin Eau Claire purchased the priory in the past few years and has been using the buildings as a childcare facility. The property surrounding the structures however, provide a great outdoor learning center for classes like our. Check out the following maps for further imagery info.
Methodology/Results:
Week 1
For this exercise it’s important to remember last weeks exercise in creating our maps. These maps were not simply handed to us, we had to take the raw data and create our own topographic maps. Should any questions or issues arise, take note of last week’s write-up.
When we arrived at the Priory we went inside to have group planning before heading off into the woods to follow our land navigation course.
Al Wiberg giving a crash course on compass navigation highlighted this time inside. He reminded us that the first step in compass navigation is to take note of the Magnetic declination. This is the degree to which magnetic north and true north vary, and needs to be accounted for before navigating using your compass. As we discovered earlier in the year, Eau Claire’s magnetic declination is less than one degree, so it’s not something we have to worry about when measuring with this degree of accuracy (we aren’t measuring to fractions of degrees so any notation of declination would be beyond our level of accuracy anyways.) However, if using different, more accurate, tools, this magnetic declination would be a necessary adjustment.
Next he walked us through an example of navigation planning using our map. By taking our origin point and finding our second point, he showed us that by laying our compass on the origin, with the HEADING arrow pointed directly at our second point we can determine the azimuth at which the second point is, in relation to the first point. (refer to Figure 3)
With our compass edge on the origin point, and HEADING arrow pointed directly at our next destination we can then turn the HOUSING/BEZEL until our red red box or 'shed' and the reference lines on the bezel are parrallel with the UTM grid on the map.Then the bearing arrow (and extension of our heading arrow) will tell us exactly what the azimuth is towards our destination point. Step by step directions are as follows:
1.Lay compass base plate edge on origin point, so that it also lines up with destination point. (use a piece of paper to 'extend' your baseplate if needed
2.Orient heading arrow pointed directly at destination point.
3.Rotate housing to ensure that the red box or 'shed' and the reference lines on the bezel are parrallel with the UTM grid on the map.
4.Note the azimuth reading as identified by the Heading arrow azimuth degree value.
(refer to Figure 3)
After you attain your azimuth reading for the origin to the first destination, you can then measure out the distance between these two points. Since we measured our pace count in meters, we now know exactly how many of our paces it takes to travel 100 meters. Using the scale and the knowledge of our pace count it’s easy to determine exactly how far it is from point to point. This should be noted somewhere on your map or on your list of given points.
After you master the azimuth reading, and measuring your distance for the first set of points, it is easy to reproduce this for any other set of points, each time you just have a new origin and a new destination point.
Once we completed all the measurements and recorded these on our map it was time to take to the actual course. In the field we were able to start at our origin and held the compass against our bodies. We then rotated the housing on the compass to place our azimuth reading in line with our heading arrow. Then, lining the red needle up with the red ‘shed’ we were able to determine what direction our destination would be. We then used out pace count to approximate the distance, and once we were at about the right distance we panned our surroundings to search for the orienteering flag. Once finding each flag, we were able to repeat this process, simply setting up a new destination each time. (Figure 5)
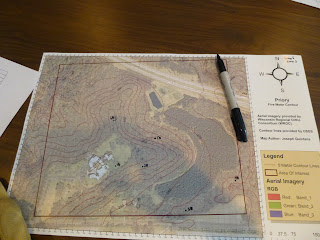 |
| Figure 5: All points plotted out for us to track on the map, and then in real life again. |
In the field we were able to take our recorded azimuths and distances and go from point to point, successfully completing the course with very few hiccups. (Figures 6+7)
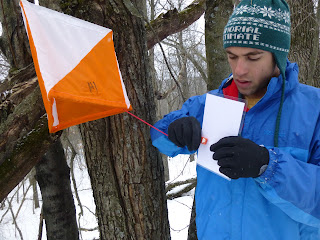 |
| Figure 6. At each desitnation we had to punch our ticket to prove we made it to each spot. |
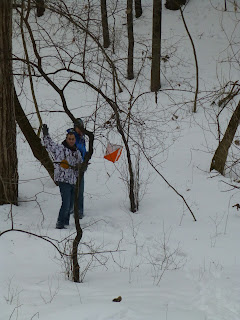 |
| Figure 7: Arriving at our destination point. Then we would shoot an Azimuth and head towards our next destination point. |
Week 2
Week 2 was slightly different, this week we could only use our UTM coordinates and a GPS unit. No maps, no compasses.
The first thing we did was to start our track logs on the Garmin eTrex unit. The track logs will be used in the lab to determine just how efficiently we travel between the points. Track log took a reading every X amount of time (for my log I believe it was every 30 seconds or every minute) so then we have a series of points to follow our path.
 |
| Figure 8: our personal GPS Unit, the Garmin eTrex. |
We then were given the list of points and the UTM coordinates by our professor. There is a function in the GPS where you can type in the UTM coordinates and the GPS will guide you there, however that would defeat the purpose of the exercise so we didn’t use it. We instead, had to watch the UTM coordinates change as we moved around, then we could get a good bearing of what direction increased and decreased out X and Y coordinates. Once we figured that out, we could navigate somewhat efficiently from point to point.
At the beginning it took a little while to figure out the exact directions. But once we were able to figure out how the cardinal directions played into the UTM directions we were able to navigate to our points rather efficiently. We completed the full 5 point course in just under 3 hours.
When we returned to the lab, it was time to import out data into the GIS. We first had to import the tracklog from the GPS unit to the GIS. To do this, we used the DNR-GPS software loaded on the computer. This gave us a list of points, and together these paths made up our path that we took through the course. After this was imported we added the shapfile to our Priory geodatabse. We also all sent out shapefiles (converted into feature classes) to our professor who added them to a public geodatabase so we could access our classmates’track logs as well.
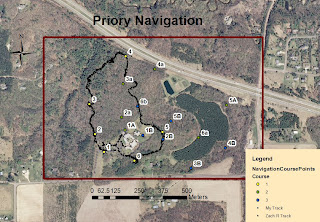
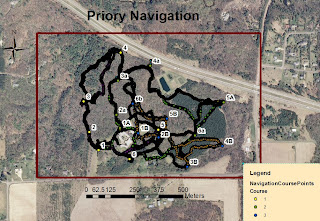
We then created maps for our own path, our group paths, and a map for the entire classes paths. Each map is provided as figures 10-12
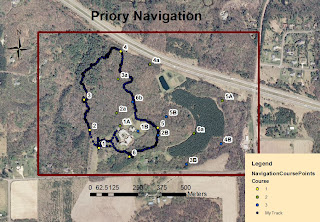 |
| Figure 10: A Map of the course overall and the path that I took according to my GPS unit. |
 |
| Figure 11: A map of the overall course and the path that my group took (Zach R. and Myself) according to our GPS units. |
 |
| Figure 12: Map of the overall course and the paths that each member of the class took. You can slightly make out the difference courses by tracing individual paths through the points. |
Week 3
Week three was again different because we added paintball to the mix. However, more importantly, this week we were able to use all the forms of navigation we had been using the past events.
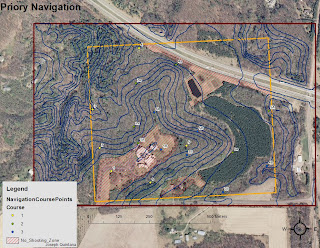 |
| Figure 13: Map of the Priory set up for Paintballing exercise. Notice the new feature, Do Not Shoot Zone. |
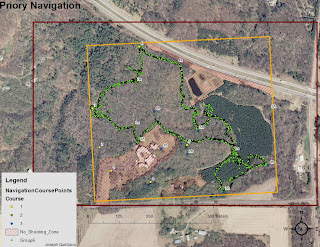 |
| Figure 14: My Group (Group 6) Path during this exercise. |
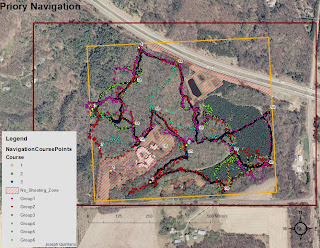 |
| Figure 15: The entire classes navigation paths for the exercise. Notice the points that no group ever managed to navigate to. |
Discussion/Conclusion:
Week1
Our method of measuring and recording while indoors really came to be of great help while working in the field. It ensured that we could use our map for reference if needed, but was not a necessary tool to whip out every single time we took a new bearing. We did however, keep the map out for most of the time, as it provided us with a good idea of what to expect in our next destination.
Using the 2foot and 5foot contour lines, we were able to determine what type of terrain we would be experiencing on our traverse to the destination point. This was helpful because it helped us stay on the right track, and we could tell if we were headed in the complete wrong direction.
Our map also allowed us to reorient ourselves if we ever lost our pace count, or the terrain was not lending itself to our mode of navigation, for instance if a hill prevented us from taking a good azimuth bearing. We were able to reorient ourselves along a road that traveled through the priory when this happened. From the edge of the road we could reshoot our azimuth and guesstimate our pace count again.
As far as our maps go, each of them seemed to function pretty well for their individual purposes. The 2-foot contour aided in the foresight process when determining the terrain surrounding our destination points, and the 5-foot contour aided in a good reference point from which to take our measurements from.
If I needed to change one thing about our maps, I would make our 2foot contour map a bit less ‘noisy’ and have it focus solely on the contour lines and a few reference points. It has a bit too much going on in it currently.
Overall this exercise was a good combination and utilization of many of the tools we have learned so far this semester. It was a good start on the way to land navigation and provides a good base from which we can experiment and learn more as we move further. The implementation of GPS next week should prove to add another, more complex layer.
Week 2
This exercise made for an interesting experience. It was somewhat difficult to navigate with ONLY using UTM coordinates. It involved a lot of walking and then checking the GPS, then walking more, checking it again, walking more, and checking again etc etc. It was also made difficult because of the fact that we still had knee deep snow at the priory. This made it difficult to watch the GPS while we walked so it turned into guess and check. It also slowed down our movement quite a bit. Had there been no snow we could have finished in probably half the time. The one area in which the snow aided was the fact that it made spotting the point flags pretty easy.
More importantly though, viewing the GPS tracks was interesting because it showed us just what type of path we took, in relation to the path we SHOULD have been taking. It also allowed us to track the differences in our groups track logs. Where we all took very similar routes, our GPS logs did not always look the same. The same is viewable with other groups as well.
Overall a good learning experience as I’ve had limited exposure to UTM coordinate navigation, and the use of the tracklogs made it pretty interesting to examine post-navigation.
Week 3
Week three proves what I have stated multiple times in this report; One tool is good, two tools are better but three tools are the best. This is on perfect display during week 3. We were able to use the three tools we had to best navigate our courses most efficiently.
Final Remarks
Final Remarks


